
Python API#
JupySQL is primarily used via the %sql, %%sql, and %sqlplot magics; however
there is a public Python API you can also use.
sql.plot#
Note
sql.plot requires matplotlib: pip install matplotlib
The sql.plot module implements functions that compute the summary statistics
in the database, a much more scalable approach that loading all your data into
memory with pandas.
histogram#
- sql.plot.histogram(payload, table, column, bins, with_=None, conn=None, category=None, cmap=None, color=None, edgecolor=None, ax=None, facet=None, breaks=None, binwidth=None, schema=None)#
Plot histogram
- Parameters
table (str) – Table name where the data is located
column (str, list) – Column(s) to plot
bins (int) – Number of bins
conn (connection, default=None) – Database connection. If None, it uses the current connection
Notes
Changed in version 0.5.2: Added plot title and axis labels. Allowing to pass lists in
column. Function returns amatplotlib.Axesobject.Changed in version 0.7.9: Added support for NULL values, additional filter query with new logic. Skips the rows with NULL in the column, does not raise ValueError
- Returns
ax – Generated plot
- Return type
matplotlib.Axes
Examples
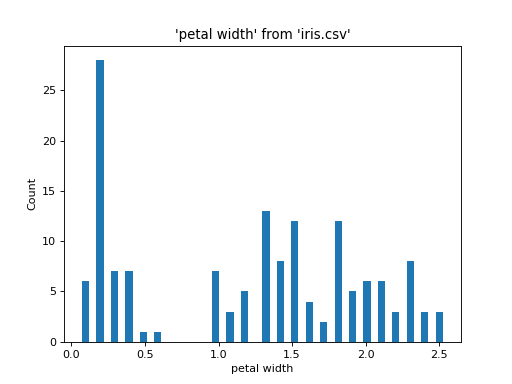
import urllib.request

from sqlalchemy import create_engine

from sql.connection import SQLAlchemyConnection
from sql import plot


urllib.request.urlretrieve(
    "https://raw.githubusercontent.com/plotly/datasets/master/iris-data.csv",
    "iris.csv",
)

conn = SQLAlchemyConnection(create_engine("duckdb://"))

plot.histogram("iris.csv", "petal width", bins=50, conn=conn)
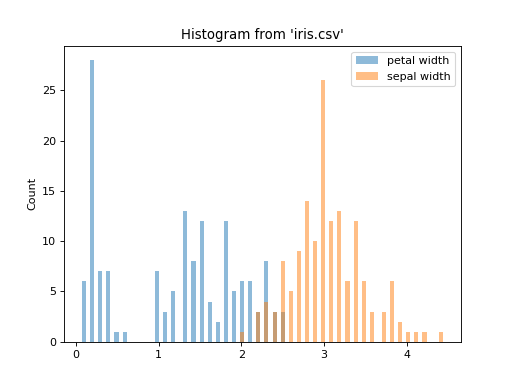
Plot multiple columns from the same table:
import urllib.request

from sqlalchemy import create_engine

from sql.connection import SQLAlchemyConnection
from sql import plot


urllib.request.urlretrieve(
    "https://raw.githubusercontent.com/plotly/datasets/master/iris-data.csv",
    "iris.csv",
)

conn = SQLAlchemyConnection(create_engine("duckdb://"))

plot.histogram("iris.csv", ["petal width", "sepal width"], bins=50, conn=conn)
boxplot#
- sql.plot.boxplot(payload, table, column, *, orient='v', with_=None, conn=None, ax=None, schema=None)#
Plot boxplot
- Parameters
table (str) – Table name where the data is located
column (str, list) – Column(s) to plot
orient (str {"h", "v"}, default="v") – Boxplot orientation (vertical/horizontal)
conn (connection, default=None) – Database connection. If None, it uses the current connection
Notes
Changed in version 0.5.2: Added
with_, andorientarguments. Added plot title and axis labels. Allowing to pass lists incolumn. Function returns amatplotlib.Axesobject.New in version 0.4.4.
- Returns
ax – Generated plot
- Return type
matplotlib.Axes
Examples
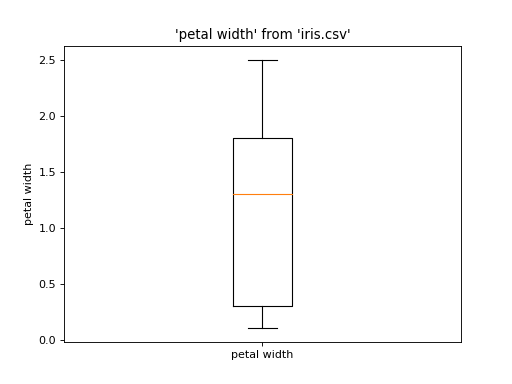
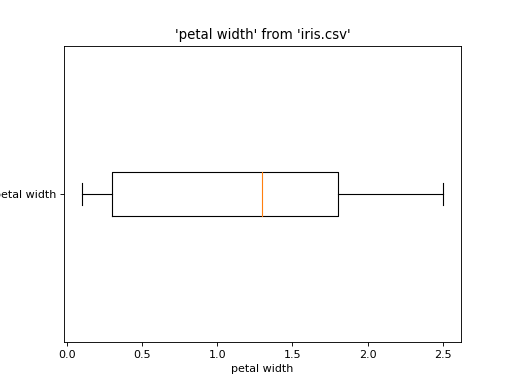
from pathlib import Path
import urllib.request

from sqlalchemy import create_engine

from sql.connection import SQLAlchemyConnection
from sql import plot


if not Path("iris.csv").is_file():
    urllib.request.urlretrieve(
        "https://raw.githubusercontent.com/plotly/datasets/master/iris-data.csv",
        "iris.csv",
    )

conn = SQLAlchemyConnection(create_engine("duckdb://"))

plot.boxplot("iris.csv", "petal width", conn=conn)
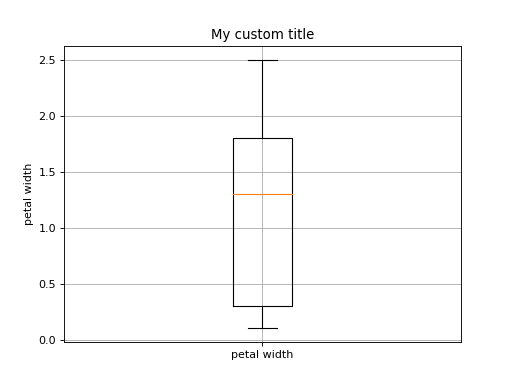
Customize plot:
from pathlib import Path
import urllib.request

from sqlalchemy import create_engine


from sql.connection import SQLAlchemyConnection
from sql import plot


if not Path("iris.csv").is_file():
    urllib.request.urlretrieve(
        "https://raw.githubusercontent.com/plotly/datasets/master/iris-data.csv",
        "iris.csv",
    )

conn = SQLAlchemyConnection(create_engine("duckdb://"))

# returns matplotlib.Axes object
ax = plot.boxplot("iris.csv", "petal width", conn=conn)
ax.set_title("My custom title")
ax.grid()
Horizontal boxplot:
from pathlib import Path
import urllib.request

from sqlalchemy import create_engine

from sql.connection import SQLAlchemyConnection

from sql import plot


if not Path("iris.csv").is_file():
    urllib.request.urlretrieve(
        "https://raw.githubusercontent.com/plotly/datasets/master/iris-data.csv",
        "iris.csv",
    )

conn = SQLAlchemyConnection(create_engine("duckdb://"))

plot.boxplot("iris.csv", "petal width", conn=conn, orient="h")
Plot multiple columns from the same table:
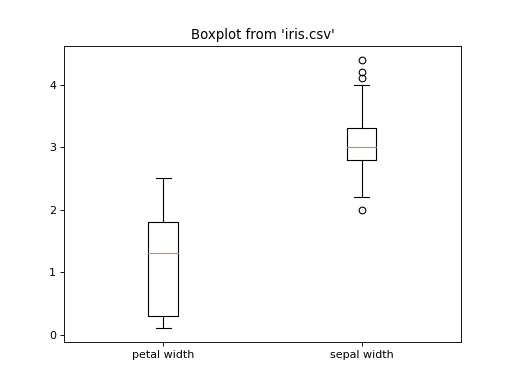
from pathlib import Path
import urllib.request

from sqlalchemy import create_engine

from sql.connection import SQLAlchemyConnection

from sql import plot


if not Path("iris.csv").is_file():
    urllib.request.urlretrieve(
        "https://raw.githubusercontent.com/plotly/datasets/master/iris-data.csv",
        "iris.csv",
    )

conn = SQLAlchemyConnection(create_engine("duckdb://"))

plot.boxplot("iris.csv", ["petal width", "sepal width"], conn=conn)
sql.store#
The sql.store module implements utilities to compose and manage large SQL queries
SQLStore#
- class sql.store.SQLStore#
Stores SQL scripts to render large queries with CTEs
Notes
New in version 0.4.3.
Examples
>>> from sql.store import SQLStore
>>> sqlstore = SQLStore()
>>> sqlstore.store("writers_fav",
...                "SELECT * FROM writers WHERE genre = 'non-fiction'")
>>> sqlstore.store("writers_fav_modern",
...                "SELECT * FROM writers_fav WHERE born >= 1970",
...                with_=["writers_fav"])
>>> query = sqlstore.render("SELECT * FROM writers_fav_modern LIMIT 10",
...                         with_=["writers_fav_modern"])
>>> print(query)
WITH "writers_fav" AS (
    SELECT * FROM writers WHERE genre = 'non-fiction'
), "writers_fav_modern" AS (
    SELECT * FROM writers_fav WHERE born >= 1970
)
SELECT * FROM writers_fav_modern LIMIT 10
sql.run.run#
The sql.run.run module implements utility function for running SQL statements with the given connection.
run_statements#
- sql.run.run.run_statements(conn, sql, config, parameters=None)#
Run a SQL query (supports running multiple SQL statements) with the given connection. This is the function that’s called when executing SQL magic.
- Parameters
conn (sql.connection.AbstractConnection) – The connection to use
sql (str) – SQL query to execution
config – Configuration object
Examples
from sql.run import run
from sqlalchemy import create_engine
from sql.connection import SQLAlchemyConnection
from sql.magic import SqlMagic
from IPython.core.interactiveshell import InteractiveShell

ip = InteractiveShell()

sqlmagic = SqlMagic(shell=ip)
ip.register_magics(sqlmagic)

# Modify config options if needed
sqlmagic.feedback = 1
sqlmagic.autopandas = True

conn = SQLAlchemyConnection(create_engine("duckdb://"))

run.run_statements(conn, "CREATE TABLE numbers (num INTEGER)", config=sqlmagic)
run.run_statements(conn, "INSERT INTO numbers values (1)", config=sqlmagic)
run.run_statements(conn, "INSERT INTO numbers values (2)", config=sqlmagic)
run.run_statements(conn, "INSERT INTO numbers values (1)", config=sqlmagic)

query_result = run.run_statements(conn, "SELECT * FROM numbers", config=sqlmagic)
print(query_result)