
Quick Start#
JupySQL allows you to run SQL and plot large datasets in Jupyter via a %sql, %%sql, and %sqlplot magics. JupySQL is compatible with all major databases (e.g., PostgreSQL, MySQL, SQL Server), data warehouses (e.g., Snowflake, BigQuery, Redshift), and embedded engines (SQLite, and DuckDB).
It is a fork of ipython-sql with many bug fixes and a lot of great new features!
Installation#
Run this on your terminal (we’ll use DuckDB for this example):
pip install jupysql duckdb-engine
Or the following in a Jupyter notebook:
%pip install jupysql duckdb-engine --quiet
Note: you may need to restart the kernel to use updated packages.
You might also install it from conda:
conda install jupysql -c conda-forge
Setup#
Tip
If you are unfamiliar with Jupyter magics, you can refer to our FAQ. Also, you can view the documentation and command line arguments of any magic command by running %magic? like %sql? or %sqlplot?.
Load the extension:
%load_ext sql
Let’s download some sample .csv data:
from pathlib import Path
from urllib.request import urlretrieve

if not Path("penguins.csv").is_file():
    urlretrieve(
        "https://raw.githubusercontent.com/mwaskom/seaborn-data/master/penguins.csv",
        "penguins.csv",
    )
Start a DuckDB in-memory database:
%sql duckdb://
Tip
You can create as many connections as you want. Pass an --alias {alias} to easily
switch them or close them.
Querying#
For short queries, you can write them in a single line via the %sql line magic:
%sql SELECT * FROM penguins.csv LIMIT 3
| species | island | bill_length_mm | bill_depth_mm | flipper_length_mm | body_mass_g | sex |
|---|---|---|---|---|---|---|
| Adelie | Torgersen | 39.1 | 18.7 | 181 | 3750 | MALE |
| Adelie | Torgersen | 39.5 | 17.4 | 186 | 3800 | FEMALE |
| Adelie | Torgersen | 40.3 | 18.0 | 195 | 3250 | FEMALE |
For longer queries, you can break them down into multiple lines using the %%sql cell magic:
%%sql
SELECT *
FROM penguins.csv
WHERE bill_length_mm > 40
LIMIT 3
| species | island | bill_length_mm | bill_depth_mm | flipper_length_mm | body_mass_g | sex |
|---|---|---|---|---|---|---|
| Adelie | Torgersen | 40.3 | 18.0 | 195 | 3250 | FEMALE |
| Adelie | Torgersen | 42.0 | 20.2 | 190 | 4250 | None |
| Adelie | Torgersen | 41.1 | 17.6 | 182 | 3200 | FEMALE |
Saving queries#
%%sql --save not_nulls --no-execute
SELECT *
FROM penguins.csv
WHERE bill_length_mm IS NOT NULL
AND bill_depth_mm IS NOT NULL
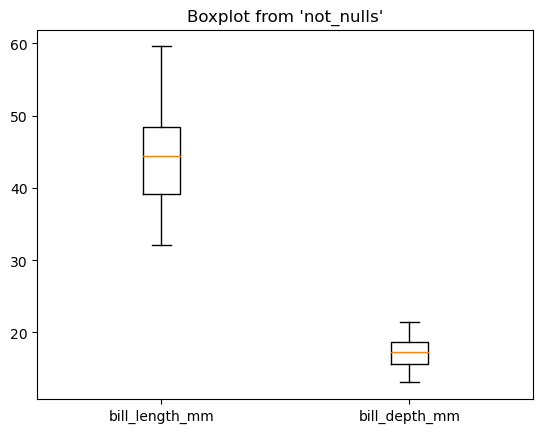
Plotting#
%sqlplot boxplot --column bill_length_mm bill_depth_mm --table not_nulls
<Axes: title={'center': "Boxplot from 'not_nulls'"}>
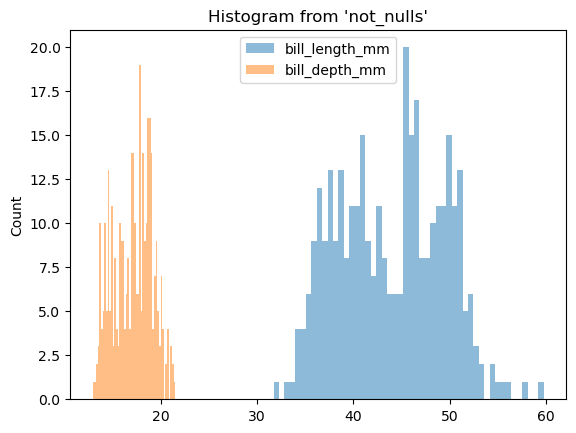
%sqlplot histogram --column bill_length_mm bill_depth_mm --table not_nulls
<Axes: title={'center': "Histogram from 'not_nulls'"}, ylabel='Count'>
pandas integration#
result = %sql SELECT * FROM penguins.csv
df = result.DataFrame()
df.head()
| species | island | bill_length_mm | bill_depth_mm | flipper_length_mm | body_mass_g | sex | |
|---|---|---|---|---|---|---|---|
| 0 | Adelie | Torgersen | 39.1 | 18.7 | 181.0 | 3750.0 | MALE |
| 1 | Adelie | Torgersen | 39.5 | 17.4 | 186.0 | 3800.0 | FEMALE |
| 2 | Adelie | Torgersen | 40.3 | 18.0 | 195.0 | 3250.0 | FEMALE |
| 3 | Adelie | Torgersen | NaN | NaN | NaN | NaN | NaN |
| 4 | Adelie | Torgersen | 36.7 | 19.3 | 193.0 | 3450.0 | FEMALE |