
Spark#
New in version 0.10.7.
This tutorial will show you how to get a Spark instance up and running locally to integrate with JupySQL. You can run this in a Jupyter notebook. We’ll use Spark Connect which is the new thin client for Spark
Pre-requisites#
To run this tutorial, you need to install following Python packages:
%pip install jupysql pyspark==3.4.1 arrow pyarrow==12.0.1 pandas grpcio-status --quiet
Note: you may need to restart the kernel to use updated packages.
Start Spark instance#
We’ll use a the sparglim Docker image to ease setup:
%%bash
docker run -p 15002:15002 -p 4040:4040 -d --name spark wh1isper/sparglim-server
12f699ee8e8e35ab10186f3c39024a7e443691bb4213e56ca3c2e90cd80daf1b
Our database is running, let’s load some data!
Load sample data#
Now, let’s fetch some sample data. We’ll be using the NYC taxi dataset:
import pandas as pd
from pyspark.sql.connect.session import SparkSession

spark = SparkSession.builder.remote("sc://localhost").getOrCreate()

df = pd.read_parquet(
    "https://d37ci6vzurychx.cloudfront.net/trip-data/yellow_tripdata_2021-01.parquet"
)
sparkDf = spark.createDataFrame(df.head(10000))
Set eagerEval on to print dataframes, This makes Spark print dataframes eagerly in notebook environments, rather than it’s default lazy execution which requires .show() to see the data. In Spark 3.4.1 we need to override, as below, but in 3.5.0 it will print in html.
def __pretty_(self, p, cycle):
    self.show(truncate=False)


from pyspark.sql.connect.dataframe import DataFrame

DataFrame._repr_pretty_ = __pretty_
spark.conf.set("spark.sql.repl.eagerEval.enabled", True)
Add dataset to temporary view to allow querying:
sparkDf.createOrReplaceTempView("taxi")
Query#
Now, let’s start JupySQL, authenticate, and query the data!
%load_ext sql
The sql extension is already loaded. To reload it, use:
  %reload_ext sql
%sql spark
Important
If the cell above fails, you might have some missing packages. Message us on Slack and we’ll help you!
List the tables in the database:
%sql show views in default
| namespace | viewName | isTemporary |
|---|---|---|
| taxi | True |
We can turn on lazy_spark to avoid executing spark plan and return a Spark Dataframe
%config SqlMagic.lazy_execution = True
%sql show views in default
+---------+--------+-----------+
|namespace|viewName|isTemporary|
+---------+--------+-----------+
|         |taxi    |true       |
+---------+--------+-----------+
%config SqlMagic.lazy_execution = False
List columns in the taxi table:
df = %sql select * from taxi
df.sqlaproxy.dataframe.printSchema()
root
 |-- VendorID: long (nullable = true)
 |-- tpep_pickup_datetime: timestamp (nullable = true)
 |-- tpep_dropoff_datetime: timestamp (nullable = true)
 |-- passenger_count: double (nullable = true)
 |-- trip_distance: double (nullable = true)
 |-- RatecodeID: double (nullable = true)
 |-- store_and_fwd_flag: string (nullable = true)
 |-- PULocationID: long (nullable = true)
 |-- DOLocationID: long (nullable = true)
 |-- payment_type: long (nullable = true)
 |-- fare_amount: double (nullable = true)
 |-- extra: double (nullable = true)
 |-- mta_tax: double (nullable = true)
 |-- tip_amount: double (nullable = true)
 |-- tolls_amount: double (nullable = true)
 |-- improvement_surcharge: double (nullable = true)
 |-- total_amount: double (nullable = true)
 |-- congestion_surcharge: double (nullable = true)
 |-- airport_fee: double (nullable = true)
Query our data:
%%sql
SELECT COUNT(*) FROM taxi
| count(1) |
|---|
| 10000 |
Parameterize queries#
threshold = 10
%%sql
SELECT COUNT(*) FROM taxi
WHERE trip_distance < {{threshold}}
| count(1) |
|---|
| 9476 |
threshold = 0.5
%%sql
SELECT COUNT(*) FROM taxi
WHERE trip_distance < {{threshold}}
| count(1) |
|---|
| 642 |
CTEs#
%%sql --save many_passengers --no-execute
SELECT *
FROM taxi
WHERE passenger_count > 3
-- remove top 1% outliers for better visualization
AND trip_distance < 18.93
%%sql --save trip_stats --with many_passengers
SELECT MIN(trip_distance), AVG(trip_distance), MAX(trip_distance)
FROM many_passengers
| min(trip_distance) | avg(trip_distance) | max(trip_distance) |
|---|---|---|
| 0.0 | 3.1091381872213963 | 18.46 |
This is what JupySQL executes:
query = %sqlcmd snippets trip_stats
print(query)
WITH `many_passengers` AS (
SELECT *
FROM taxi
WHERE passenger_count > 3

AND trip_distance < 18.93)
SELECT MIN(trip_distance), AVG(trip_distance), MAX(trip_distance)
FROM many_passengers
Profiling#
%sqlcmd profile -t taxi
| VendorID | tpep_pickup_datetime | tpep_dropoff_datetime | passenger_count | trip_distance | RatecodeID | store_and_fwd_flag | PULocationID | DOLocationID | payment_type | fare_amount | extra | mta_tax | tip_amount | tolls_amount | improvement_surcharge | total_amount | congestion_surcharge | airport_fee | |
|---|---|---|---|---|---|---|---|---|---|---|---|---|---|---|---|---|---|---|---|
| count | 10000 | 10000 | 10000 | 10000 | 10000 | 10000 | 10000 | 10000 | 10000 | 10000 | 10000 | 10000 | 10000 | 10000 | 10000 | 10000 | 10000 | 10000 | 0 |
| unique | 2 | 8766 | 8745 | 7 | 1243 | 6 | 2 | 173 | 230 | 4 | 228 | 8 | 3 | 504 | 18 | 3 | 959 | 3 | 0 |
| top | nan | 2021-01-01 00:41:19 | 2021-01-02 00:00:00 | nan | nan | nan | N | nan | nan | nan | nan | nan | nan | nan | nan | nan | nan | nan | None |
| freq | nan | 4 | 7 | nan | nan | nan | 9808 | nan | nan | nan | nan | nan | nan | nan | nan | nan | nan | nan | 0 |
| mean | 1.6901 | nan | nan | 1.5080 | 3.1002 | 1.0712 | nan | 158.5551 | 154.7296 | 1.3819 | 11.8822 | 0.8259 | 0.4864 | 1.7846 | 0.2246 | 0.2945 | 16.9696 | 2.1063 | nan |
| std | 0.4625 | nan | nan | 1.1354 | 3.5970 | 1.0755 | nan | 70.9288 | 75.2504 | 0.5552 | 10.8420 | 1.1167 | 0.1041 | 2.4351 | 1.2730 | 0.0570 | 12.5023 | 0.9562 | nan |
| min | 1 | nan | nan | 0.0 | 0.0 | 1.0 | nan | 1 | 1 | 1 | -100.0 | -0.5 | -0.5 | -1.07 | -6.12 | -0.3 | -100.3 | -2.5 | nan |
| 25% | 1.0000 | nan | nan | 1.0000 | 1.0400 | 1.0000 | nan | 100.0000 | 83.0000 | 1.0000 | 6.0000 | 0.0000 | 0.5000 | 0.0000 | 0.0000 | 0.3000 | 10.3000 | 2.5000 | nan |
| 50% | 2.0000 | nan | nan | 1.0000 | 1.9300 | 1.0000 | nan | 152.0000 | 151.0000 | 1.0000 | 8.5000 | 0.5000 | 0.5000 | 1.5400 | 0.0000 | 0.3000 | 13.5500 | 2.5000 | nan |
| 75% | 2.0000 | nan | nan | 2.0000 | 3.6000 | 1.0000 | nan | 234.0000 | 234.0000 | 2.0000 | 13.5000 | 2.5000 | 0.5000 | 2.6500 | 0.0000 | 0.3000 | 19.3000 | 2.5000 | nan |
| max | 2 | nan | nan | 6.0 | 45.92 | 99.0 | nan | 265 | 265 | 4 | 121.0 | 3.5 | 0.5 | 80.0 | 25.5 | 0.3 | 137.76 | 2.5 | nan |
Plotting#
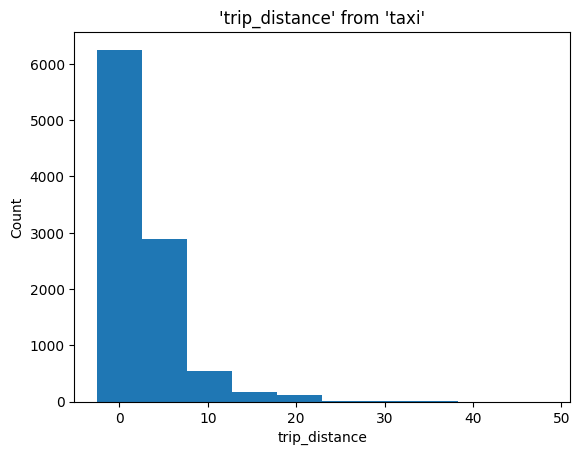
%sqlplot histogram --table taxi --column trip_distance --bins 10
<Axes: title={'center': "'trip_distance' from 'taxi'"}, xlabel='trip_distance', ylabel='Count'>
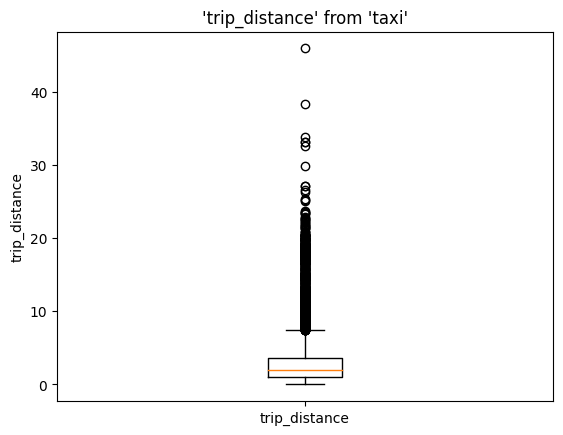
%sqlplot boxplot --table taxi --column trip_distance
<Axes: title={'center': "'trip_distance' from 'taxi'"}, ylabel='trip_distance'>
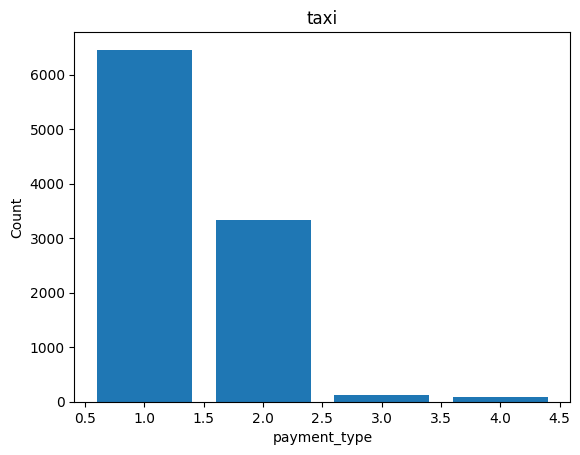
%sqlplot bar --table taxi --column payment_type
<Axes: title={'center': 'taxi'}, xlabel='payment_type', ylabel='Count'>
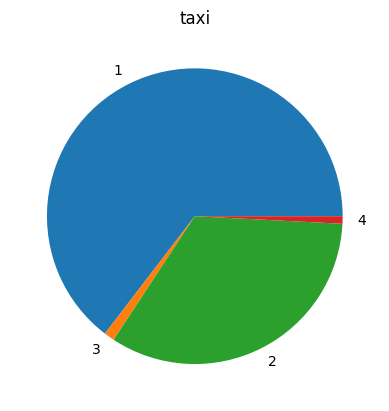
%sqlplot pie --table taxi --column payment_type
<Axes: title={'center': 'taxi'}>
from sql.ggplot import ggplot, aes, geom_histogram
(ggplot(table="taxi", mapping=aes(x="trip_distance")) + geom_histogram(bins=10))
<sql.ggplot.ggplot.ggplot at 0x14efcf7f0>
Clean up#
To stop and remove the container:
! docker container ls
CONTAINER ID   IMAGE                                                      COMMAND                  CREATED              STATUS              PORTS                                              NAMES
12f699ee8e8e   wh1isper/sparglim-server                                   "tini -- sparglim-se…"   About a minute ago   Up About a minute   0.0.0.0:4040->4040/tcp, 0.0.0.0:15002->15002/tcp   spark
f019407c6426   docker.dev.slicelife.com/onelogin-aws-assume-role:stable   "onelogin-aws-assume…"   2 weeks ago          Up 2 weeks                                                             heuristic_tu
%%capture out
! docker container ls --filter ancestor=wh1isper/sparglim-server --quiet
container_id = out.stdout.strip()
print(f"Container id: {container_id}")
Container id: 12f699ee8e8e
! docker container stop {container_id}
12f699ee8e8e
! docker container rm {container_id}
12f699ee8e8e